Predicting Starbucks Offer Success and finding most relevant factors for offer success
Blog for Udacity Data Scientist Nanodegree Starbucks Capstone Challenge
Project Overview
I am writing this Blog to report my finding for the Starbuck's Capstone Project of the Udacity Data Science Nanodegree.
Starbucks is providing data on their promotional offers to be analyzed, the data set contains simulated data that mimics customer behavior on the Starbucks rewards mobile app.
You can here find GitHub repository of project and Detailed explanation of code in Jupyter Notebook file of project.
Business understanding
In this analysis, I want to try to reach to Solution with Data I have. Data -> Question -> Solution.
Problem Statement
Can we classify if an offer is going to be successful based on demographic and offer information?
- My approach would be to Build a machine learning model to predict offer success based on the demographic information and the offer details that are provided in the data.
Which offer is the most successful?
- Who spends more money? male or female?
For 2 questions, I am planning to plot a graph with required entities to get insight.
Data Understanding
The dataset is contained in three files:
- portfolio.json - containing offer ids and meta data about each offer (duration, type, etc.)
- profile.json - demographic data for each customer
- transcript.json - records for transactions, offers received, offers viewed, and offers completed.
Data cleaning
I am following below steps for data cleaning in profile, portfolio and transcript dataset.
- Check how many data entries are missing values and find any correlation for missing values.
- It is interesting to see in profile data that for every gender with value None, the income is also unknown. Also when both are unknown, age is set to 118 for all the rows with NaN values. And missing values is roughly 12.8%, as this is less percentage, my strategy is to drop those for the machine learning model. Thus, I am not considering for implementing an imputation strategy here.
- Create dummies for categorical data type columns
- Create a datetime format for required columns.
I am adding a new dataframe called moneyspent from transcript and profile data, merging using customer Id to see behavior of money spent based on gender.
Who spends more money? male or female?
To understand this, plot graph based on gender and amount spent.
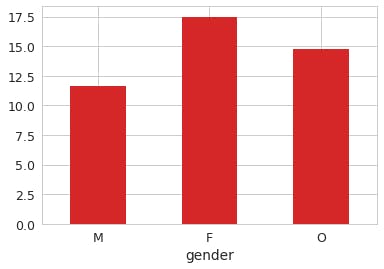
From this graph it can be clearly analyzed that women spend more money in general.
Plot a graph to see distribution/ of each event like offer received, viewed, completed over offer types like bogo, discount, informational.
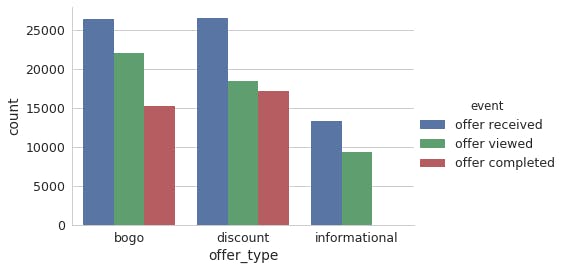
A lot of people receive offer, out of which many people view the offer, and only a few people to actual transaction to get the offer. Since sending offers is cost to company, sending offers to right set of people is important and can attract more people doing transaction.
Data Preparation
Just data cleaning is not enough, there could be few conditions where new data needs to be prepared based on existing data to get more insights about the data.
There is a specific case in dataset because of which this step is necessary.
Offer can be completed and benefit can be availed without actually viewing the offer. So these customers would any ways made a purchase so identifying these customers is necessary.
I will have a separate column to define which outcomes in the data can be classified as success cases.
BOGO and Discount Offers In general, possible event paths for BOGO and discount offers are:
- successful offer: offer received → offer viewed → transaction(s) → offer completed
- ineffective offer: offer received → offer viewed
- unviewed offer: offer received
- unviewed success: offer received → transaction(s) → offer completed
While successful offer is the path that reflects that an offer was successfully completed after viewing it that is what we want(desirable outcome)
both ineffective offer and unviewed offer reflect that the offer was not successful, i.e., did not lead to transactions by the customer (or to insufficient transactions).This can be treated as failure of offer.
However, it is important to keep in mind that there can also be unviewed success cases, meaning that the customer has not viewed the offer, but completed it anyways, i.e., that the customer made transactions regardless of the offer.
Thus it is very much important to separate unviewed success from successful offer, so that targeting right customers can be achieved.
Ideally, Starbucks might want to target those customer groups that exhibit event path 1,
while not targeting those that are most likely to follow paths 2 and 3 because those are not going to make transactions
or 4 because those make transactions anyways, so Starbucks would actually lose money by giving them discounts or BOGO offers.
So after this step, I will have a column called success which will have value 1 if it is a successful offer, and 0 otherwise.
Now I will merge all the data into one dataframe called full_data to give to Machine learning classification model.
Predicting Offer Success with Classification model
I am defining a function called Classification_model with Randomforest model as default classifier.
Metric used are accuracy_score, roc_auc_score.
For Random forest model I am getting following result.
                 precision    recall  f1-score   support

    failure       0.70      0.70      0.70     10390
    success       0.67      0.67      0.67      9561

avg / total       0.69      0.69      0.69     19951

Overall model accuracy:     0.686331512204902
Train ROC AUC score:     0.9863216113589416
Test ROC AUC score:     0.7465330713208808
And for AdaBoost classifier I am getting below result.
             precision    recall  f1-score   support

    failure       0.68      0.68      0.68     10390
    success       0.66      0.66      0.66      9561

avg / total       0.67      0.67      0.67     19951

Overall model accuracy:     0.6710941807428199
Train ROC AUC score:     0.7295966493333714
Test ROC AUC score:     0.7299133701950669
Out of which I feel AdaBoostClassifier is performing better without offerfitting, so
the AdaBoost classification model can be used to predict whether an offer is going to be successfully completed based on customer and offer characteristics.
I am performing GridSearchCV on AdaBoostClassifier on below parameters:
param_grid={'n_estimators': [50, 100, 500],
            'learning_rate': [0.1,0.7, 1],
             'algorithm': ['SAMME.R','SAMME']}
and I got below parameters as best parameters.
{
   'algorithm': 'SAMME.R',
   'learning_rate': 0.1,
   'n_estimators': 500
}
After applying these parameters, I got below result:
             precision    recall  f1-score   support

    failure       0.68      0.68      0.68     10390
    success       0.65      0.66      0.65      9561

avg / total       0.67      0.67      0.67     19951

Overall model accuracy:     0.6689890231066112
Train ROC AUC score:     0.7295248849870593
Test ROC AUC score:     0.7302833968483007
The optimal model found via gridsearchcv does not perform better than the initial model using mostly default settings. So I using overall_model that is Adaboost classifier with default settings for further process.
The final model I consider has an accuracy of 67%, which is a decent number, although there is certainly room for improvement.
Based on model I am plotting Feature importance of data used for model.
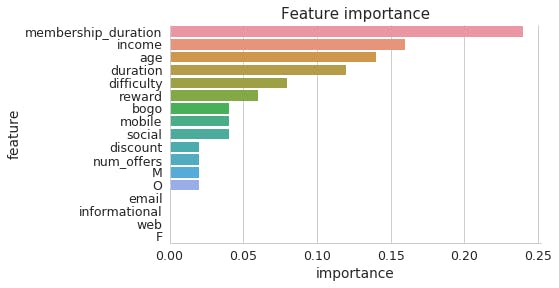
The most relevant factors for offer success based on the model are:
- Membership duration
- Income
- Age
- offer Duration
Which offer is the most successful?
To understand this I am plotting graph for Comparing the performance of BOGO and discount offer.
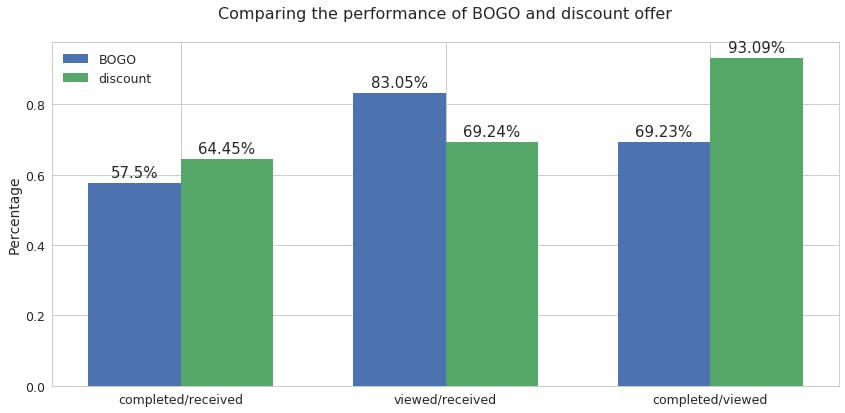
By looking at the graph it can be said that Discount offer is more successful because
not only the absolute number of 'offer completed' is slightly higher than BOGO offer, its overall completed/received rate is also about 7% higher. However, BOGO offer has a much greater chance to be viewed or seen by customers. But turning offer received to offer completed can be done by discount offer than bogo offer.
we can also check for offers that led to successful offer meaning it took following path offer received → offer viewed → transaction(s) → offer completed.
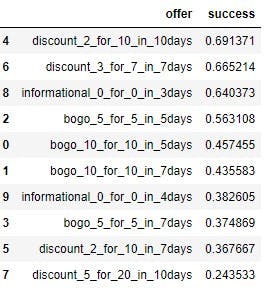
This also shows that discount offer is better performing than Bogo offer.
Reflection and Improvement include:
- Explore better modeling techniques and algorithms to see whether model performance can be improved in this way.
- Do not drop the observations with missing values, but use some kind of imputation strategy to see whether the model can be improved this way.